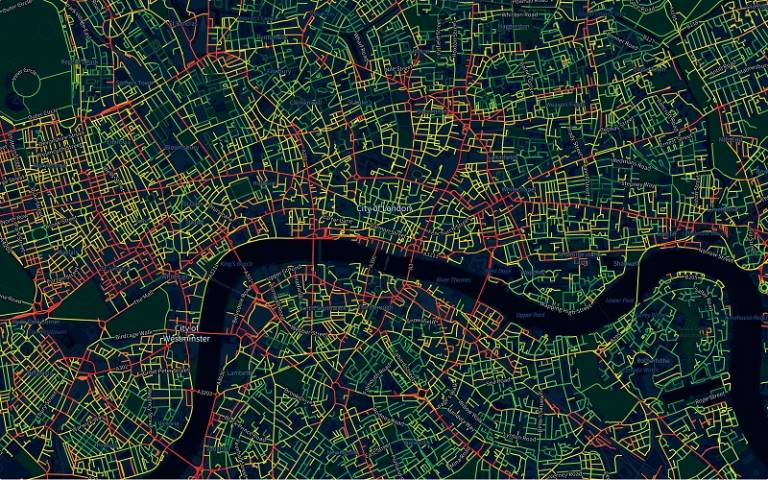
An interactive map launched by University College London (UCL) rates how healthy every street in London is based on air pollution, noise levels, pavement space and the amount of foliage.
The Healthy Streets Index has combined the ten indicators known to have the biggest impact on health and wellbeing to rate every street in an interactive map.
Aside from air pollution levels, other aspects such as access to services and public transport have been considered when judging the healthiness of a street.
Park Lane, in the City of Westminster, and Brompton Road, in in the Royal Borough of Kensington, were both rated in the bottom 5 per cent of London’s road, being well-known for heavy traffic.
The map also shows significant health variations between London boroughs, with Camden having one in six streets in the top 5 per cent, while Bexley only has one in 500.
Meanwhile, Hillingdon contained the highest proportion of least least healthy streets, with one in 14 in the bottom 5 per cent.
Creators explained they wanted this map to inform Londoners where to live.
Urban designer Nicolas Palomino of the UCL Centre for Advanced Spatial Analysis, explained: ‘A key objective of the Healthy Streets Index is to quantify the human experience of streets across the multiple dimensions that define the street environment.
‘Our citywide approach can enable insightful comparisons across different neighbourhoods and provide a better understanding of the kind of city we want to design, make and live in.’
Healthy Streets has been adopted by the Mayor of London as the framework for transport and street planning, in particular for the Mayor’s Transport Strategy.
Photo Credit: Healthy Streets


